Whiz.AI
Making AI-powered commercial analytics easier to explore and share

Whiz.ai was an augmented-analytics platform that helped sales and analyst teams explore commercial data, identify trends, and share relevant findings without relying on a traditional reporting workflow.
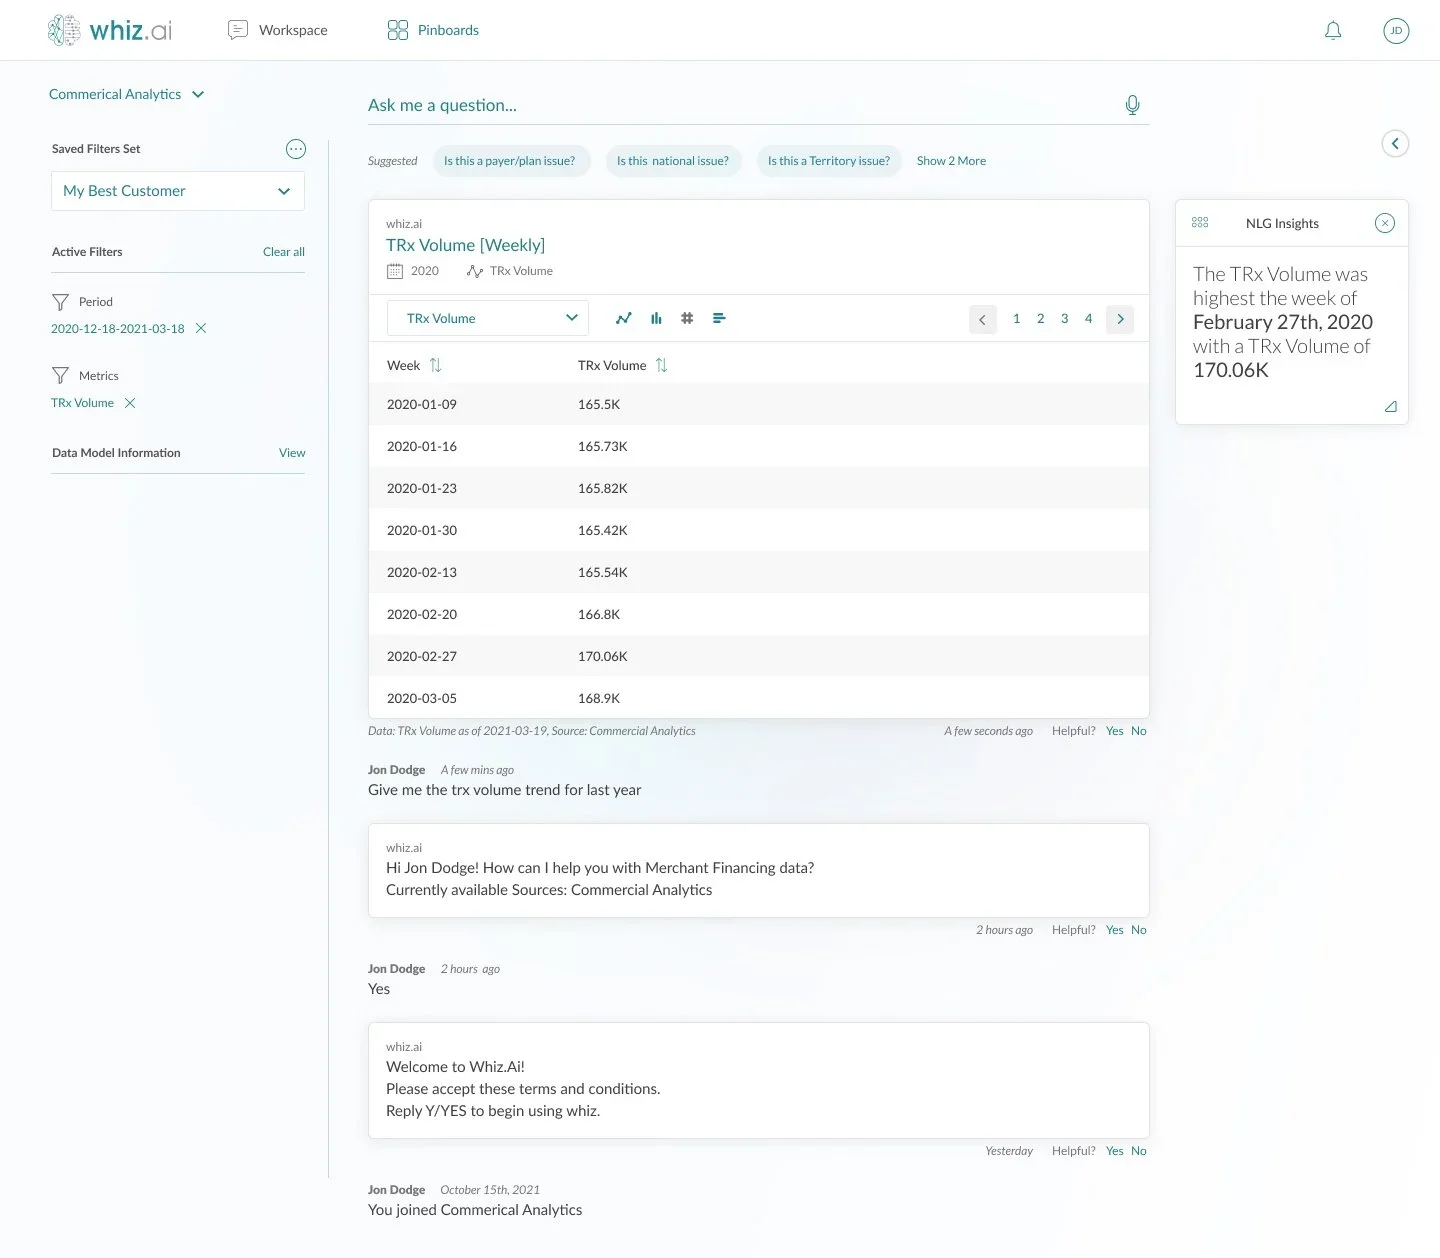
Sales and analyst teams need answers quickly, but commercial data is often spread across complex reports, dashboards, and datasets. Whiz.ai was designed to make analysis more direct: users could ask questions in natural language, apply saved filters, explore metrics and trends, receive AI-generated insights, and save useful views for others.
I reimagined the experience from the ground up, redesigning the information architecture, UX, and UI around a more approachable way to explore and act on commercial analytics.
Product Strategy
Content Strategy
Information Architecture
UX & UI Design
New Design System Creation
Responsive Desktop and Mobile Design
Scope
Role & Ownership
I led the product design work across strategy, information architecture, wireframing, prototyping, UI design, and the creation of a new design system. Working closely with the CEO, I shaped the experience from the ground up and established the product direction across the core analysis and sharing workflows.
The Real Problem
Commercial data is valuable only when sales and analyst teams can quickly find what matters, understand the result, and share it with others. Traditional reporting experiences can make that difficult by requiring users to navigate dense dashboards, work across multiple views, or depend on analysts to interpret the data for them.
Whiz.ai needed to make sophisticated analytics more accessible without stripping away the filtering, metrics, and detail users needed to trust the result.
What Changed / Outcome
I designed a connected analytics experience centered on exploration, interpretation, and sharing.
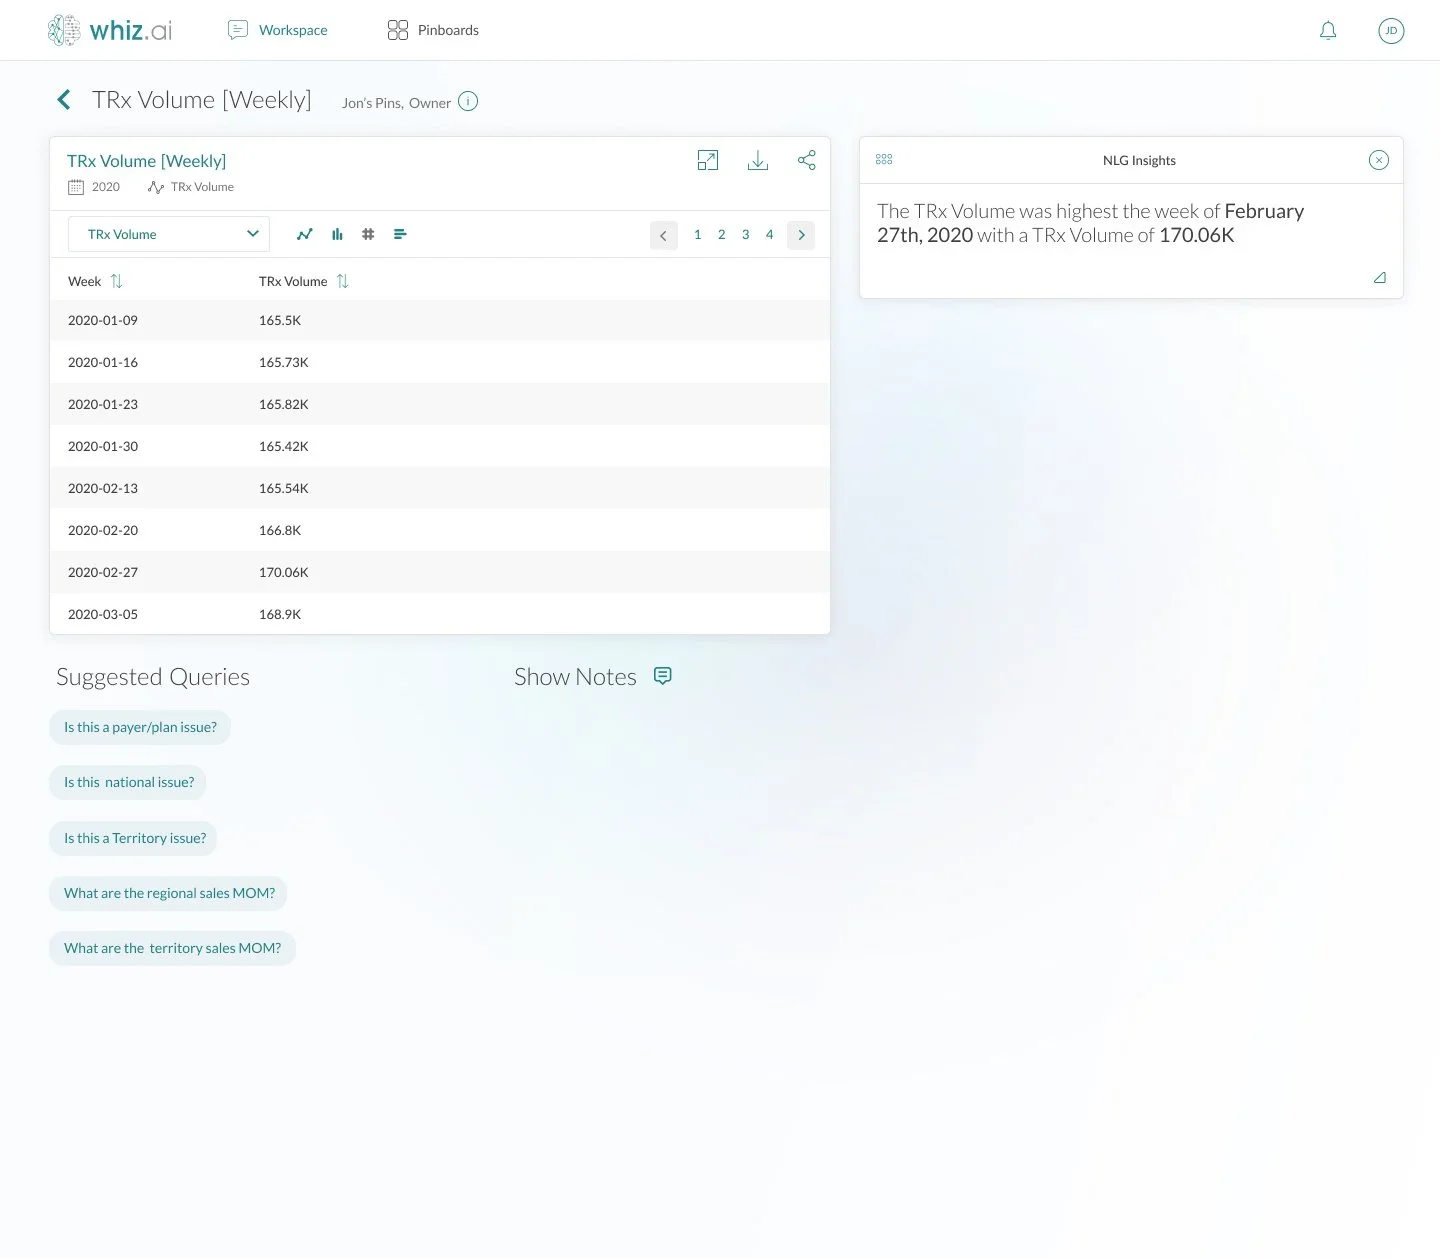
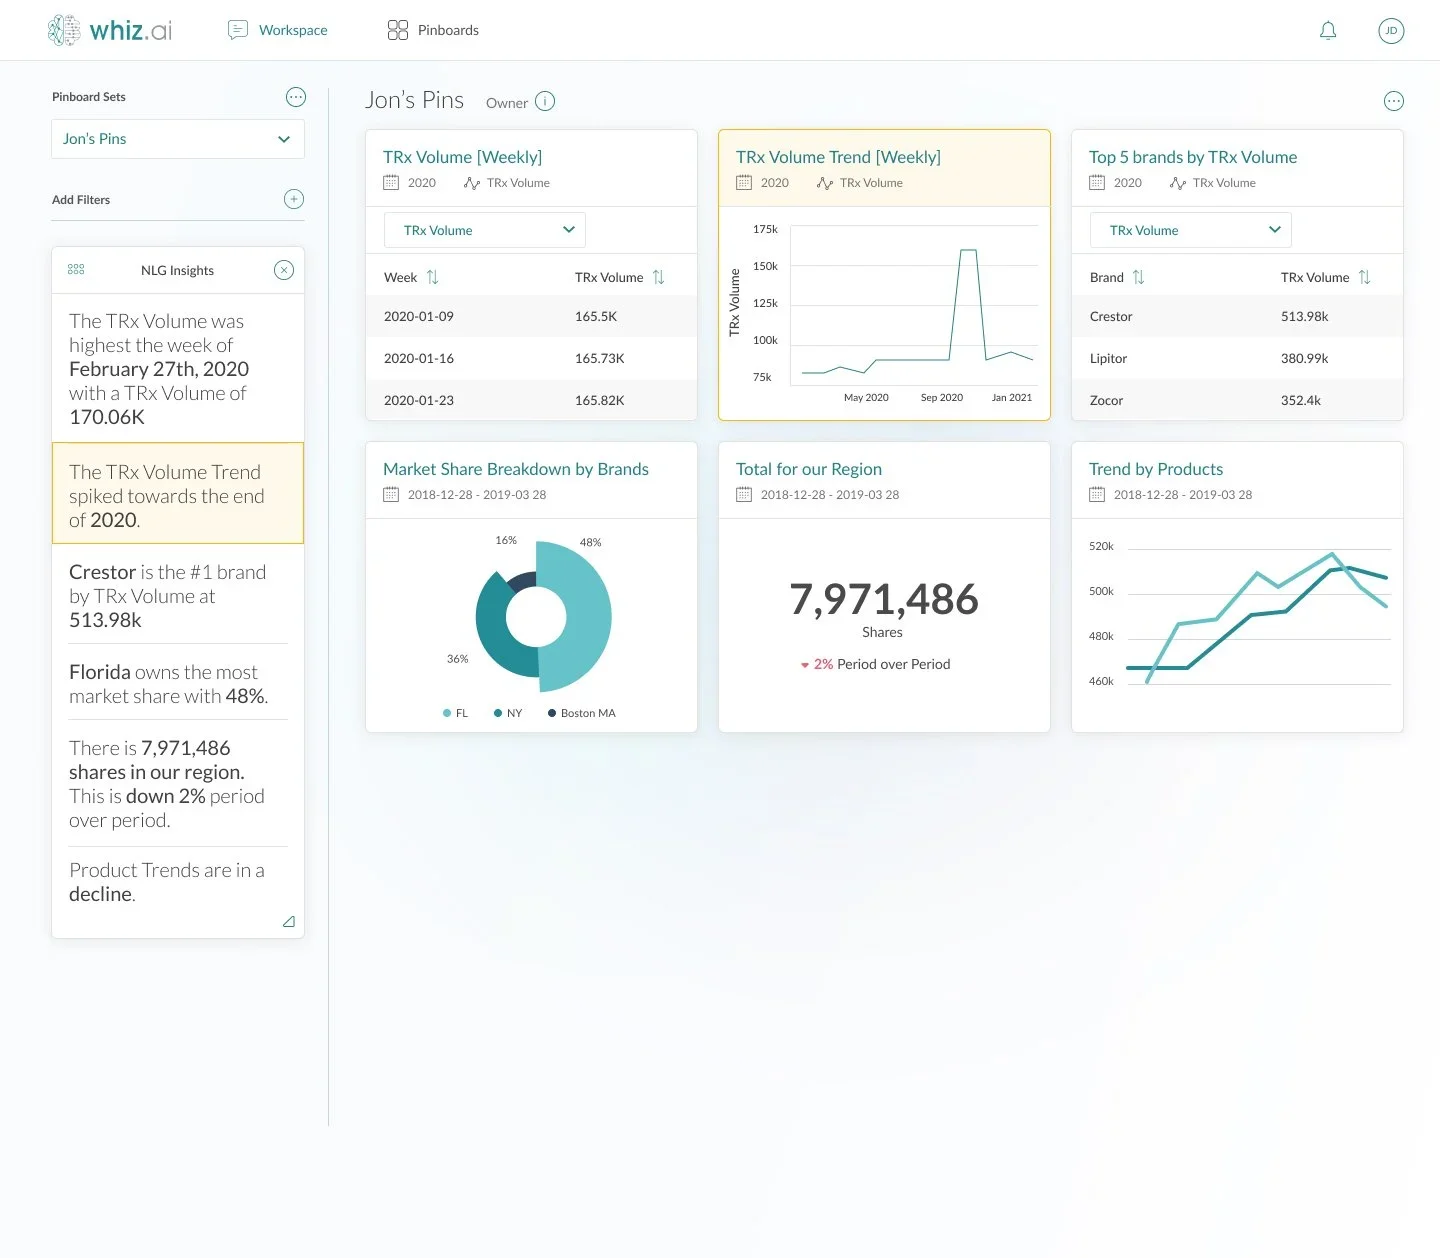
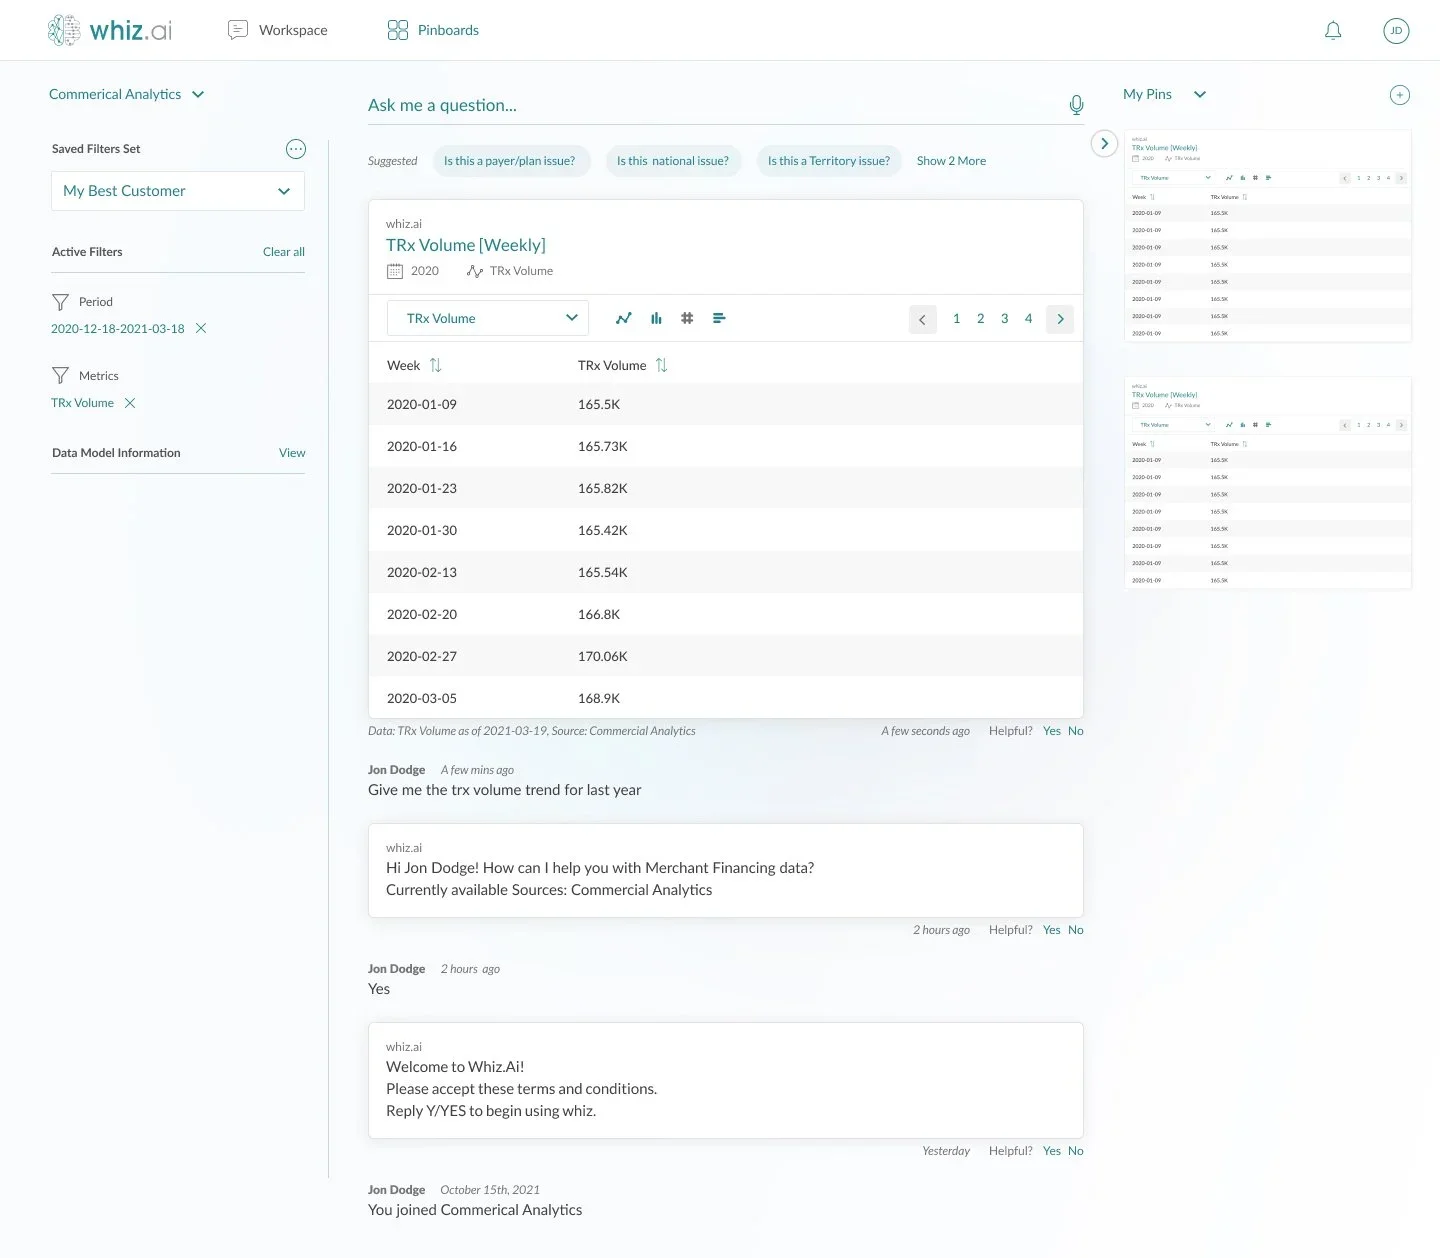
The Workspace let users ask questions in natural language, use suggested follow-up queries, apply saved filters, and explore commercial metrics in tables and charts. NLG Insights translated key data patterns into plain-language observations, helping users understand what the data was showing. Pinboards gave users a place to save, organize, and share important analyses, trends, and insights.
The work established a cohesive product direction and scalable design system for Whiz.ai’s augmented-analytics platform. The designs moved directly into development, and the product launched. I do not have verified adoption, revenue, or performance metrics to publish.